Ever stared at a property listing, trying to figure out if it’s a hidden gem or just another dud? Before you even think about firing up a complex spreadsheet, there’s a quick, back-of-the-napkin calculation that can give you an instant reality check: the Gross Rent Multiplier (GRM).
It’s the first-pass filter every savvy investor uses to see how a property’s price stacks up against its rental income. This simple number immediately tells you if a deal is even worth a second look. Think of it as your secret weapon for cutting through the noise and spotting potential winners fast.
Your Quick Guide To The Gross Rent Multiplier
So, what exactly is the Gross Rent Multiplier in plain English? Think of it like the price-to-earnings ratio for a stock, but for real estate. It’s a dead-simple metric that shows how many years it would take for a property’s gross rental income to completely pay off its purchase price.
This little calculation is your best friend when you’re screening properties. It lets you quickly compare multiple deals side-by-side without getting bogged down in the nitty-gritty of operating expenses—at least not yet. This is where serious investors start, cutting through the fluff to focus on properties with actual potential.
Key Takeaway: A lower GRM is generally a good sign. It suggests a property is pulling in more rental income relative to its price, often pointing to a stronger initial investment.
To make this crystal clear, here’s a quick breakdown of what the GRM tells you and when it’s most useful.
Gross Rent Multiplier At A Glance
| Concept | What It Means | Best Use Case |
|---|---|---|
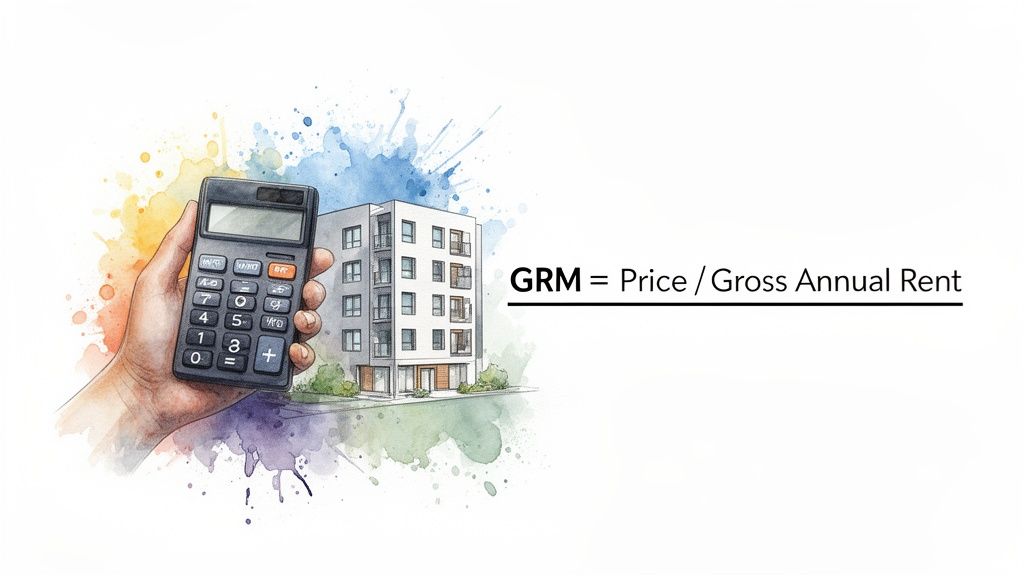
| Formula | Property Price / Gross Annual Rent | Comparing similar properties in the same neighborhood or market. |
| Purpose | Measures the relationship between price and rent. | Screening a large number of listings quickly to identify outliers. |
| Signal | A lower number indicates a faster payback period (pre-expenses). | Initial analysis before you commit time to a deep financial dive. |
This table serves as your cheat sheet. The GRM is all about making fast, informed comparisons at the very beginning of your investment journey.
The Power Of A Simple Ratio
The real beauty of the GRM is its simplicity. You only need two numbers: the property’s price and its total annual rent. With just that, you get a snapshot of how efficiently it generates income, which is absolutely critical when you’re evaluating a busy market.
Let’s say you’re looking at a multi-family building in Downtown LA, a market ACME Real Estate knows inside and out. The GRM is your gut check. It tells you how many years of rent it would take to cover the property’s price, completely ignoring expenses for a moment.
This allows you to ask the right questions upfront:
- Is this place priced fairly compared to other rentals on the block?
- Out of these three listings, which one has the best income potential for its price tag?
- Does this deal even deserve a more time-consuming financial breakdown?
Getting Started With Investment Metrics
Getting a handle on the GRM is a foundational step for anyone serious about real estate investing. It’s one of the first tools you’ll use to build confidence and start making smarter decisions. It’s not the only number that matters, of course, but it’s an indispensable part of any investor’s toolkit.
For those just starting out, we’ve put together a guide with more essential real estate investing tips for beginners to help you build a solid base.
Ultimately, the GRM gives you the context you need to decide whether to move forward or move on. To dig even deeper into this concept, check out this other comprehensive guide on What Is Gross Rent Multiplier in Real Estate Investing.
Calculating GRM with a Step-by-Step Breakdown
Alright, you get the concept. Now it’s time to roll up your sleeves and actually run the numbers. Calculating the Gross Rent Multiplier isn’t some mystical art reserved for Wall Street wizards; it’s straightforward math that anyone can master. Let’s make this a practical tool you can use today.
The beauty of the GRM is its simplicity. You only need two pieces of information: the property’s price and its total yearly rental income. That’s it.
The GRM Formula: Property Price / Gross Annual Rent = GRM
This simple equation tells you, in theory, how many years of gross rent it would take to pay back the property’s purchase price. It’s a powerful number for making quick comparisons on the fly. Let’s break it down with a real-world example you might find right here in Los Angeles.
A Practical Duplex Scenario
Imagine you’re eyeing a duplex in a vibrant LA neighborhood. The asking price is $900,000. Each unit rents for $2,500 a month.
Let’s walk through the calculation step-by-step.
- Find the Gross Monthly Rent: First, combine the income from all units. With two units at $2,500 each, your total monthly rent is $5,000.
$2,500 (Unit 1) + $2,500 (Unit 2) = $5,000 per month
- Calculate the Gross Annual Rent: This is a crucial step where a lot of people trip up. The GRM formula requires the annual income, not monthly.
$5,000 (monthly rent) x 12 (months) = $60,000 per year
- Divide the Price by the Annual Rent: Now, just plug your numbers into the formula.
$900,000 (Property Price) / $60,000 (Gross Annual Rent) = 15
The GRM for this duplex is 15. This number is your starting point, a benchmark for comparing this property against other similar duplexes in the area.
Avoiding Common Calculation Mistakes
The GRM is simple, but a few common slip-ups can completely throw off your analysis. Keep these points in mind to make sure your numbers are always on point:
- Always Use Annual Rent: Using monthly rent is the most frequent mistake. It will spit out a wildly inflated and useless number. Don’t do it.
- Use the Purchase Price or Market Value: Don’t use an old assessed value or what the seller hopes to get. Stick to the actual asking price or a realistic current market value.
- Include All Gross Income: Does the property generate extra cash from coin-operated laundry, parking spots, or storage fees? Add every last dollar to your gross annual rent. This gives you a much more accurate picture of the property’s total earning power.
That last point is a pro tip. Factoring in those extra fees from laundry and parking can significantly improve the GRM, potentially turning what looks like a decent deal into a great one. It’s this kind of detailed, on-the-ground knowledge that ACME’s local experts use—from valuation to relocation services—to ensure your slice of the City of Angels actually pays off. You can find more of the technical details about how these elements play into the Gross Rent Multiplier on Wikipedia.
Putting GRM to Work with Real-World Scenarios
Formulas are great, but the real magic happens when you see them in action. Knowing what is gross rent multiplier is one thing; using it to make a smart call is another. This is where the numbers start telling a story about a property’s potential, helping you cut through the noise and focus on what really matters.
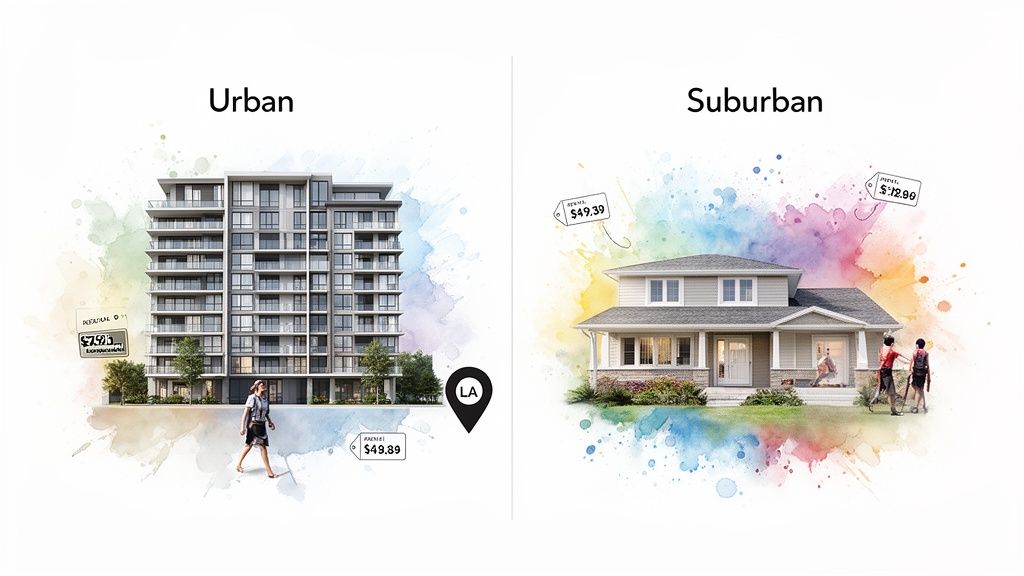
Let’s walk through two very different investment opportunities you might find right here in the Los Angeles market. We’ll pit a modern multi-unit building in a bustling urban core against a classic single-family rental out in a quieter neighborhood.
By calculating the GRM for each, you’ll see firsthand how this simple metric lets you quickly size up two completely different types of properties.
Scenario 1: The Urban Multi-Unit Building
First up, a sleek fourplex in a high-demand spot like Silver Lake. It’s close to transit, trendy coffee shops, and nightlife—a magnet for young professionals who’ll pay a premium to be in the middle of it all.
Here’s the breakdown:
- Property Price: $1,800,000
- Units: 4 identical two-bedroom apartments
- Rent per Unit: $3,000 per month
Let’s run the numbers.
- Find the Gross Monthly Rent: With four units, the total income is easy.
4 units x $3,000/month = $12,000 per month
- Calculate the Gross Annual Rent: Now, let’s see what that looks like over a year.
$12,000/month x 12 months = $144,000 per year
- Get the GRM: Finally, we plug everything into our formula.
$1,800,000 (Price) / $144,000 (Annual Rent) = 12.5
The GRM for this Silver Lake fourplex is 12.5. Stripping out all expenses, it would take twelve and a half years of rent checks to match what you paid for the building.
Scenario 2: The Suburban Single-Family Home
Next, let’s drive over to a family-friendly community in the San Fernando Valley. We’re looking at a charming three-bedroom house with a backyard that appeals to a completely different kind of tenant.
The stats for this one:
- Property Price: $950,000
- Units: 1 single-family home
- Rent: $4,500 per month
Time to calculate the GRM.
- Find the Gross Monthly Rent: This one’s simple—it’s just the one rent check.
- $4,500 per month
- Calculate the Gross Annual Rent: Let’s annualize it.
$4,500/month x 12 months = $54,000 per year
- Get the GRM: And the final step…
$950,000 (Price) / $54,000 (Annual Rent) = 17.6
The GRM for this suburban home comes in at a much higher 17.6. On paper, it would take more than 17 years for the gross rental income to cover the purchase price.
Interpreting the Results Side-by-Side
So, what are these numbers really telling us?
Based purely on the Gross Rent Multiplier, that urban fourplex (GRM of 12.5) looks like the stronger investment from an income perspective compared to the suburban home (GRM of 17.6). Its rental income is just working a lot harder relative to its price tag.
Investor Insight: The fourplex’s lower GRM is an immediate green flag. It signals a faster potential payback period from gross rents alone and tells you this property is worth digging into further.
But this is exactly where a seasoned investor—like the experts at ACME Real Estate—knows that the GRM is just a starting point, not the finish line. The single-family home might have other aces up its sleeve, like lower tenant turnover, different maintenance costs, or better long-term appreciation potential for that specific area.
Using GRM allowed us to quickly screen these two properties and see which one had more muscle when it comes to generating income efficiently. That initial gut check is the true power of the GRM. It doesn’t give you the final answer, but it definitely points you in the right direction.
How to Interpret GRM: What’s a “Good” Number?
Alright, you’ve crunched the numbers and now a Gross Rent Multiplier is staring you in the face. So what? That single digit is your first clue, a breadcrumb that can lead you toward a killer deal—or away from a total money pit. Figuring out what a GRM means isn’t about some magic number. It’s about understanding the story it tells.
In the fast-moving world of real estate investing, a low GRM is usually what gets an investor’s pulse racing. A lower number suggests the property’s price is cheap relative to the rent it pulls in. It hints that the property might pay for itself faster, at least on paper, making it an attractive first look.
But a “good” GRM isn’t a one-size-fits-all metric. It’s a moving target that shifts dramatically based on where you are, what you’re buying, and the current market vibe.
Benchmarking Is Everything
Thinking in universal terms of “good” or “bad” GRMs is a classic rookie mistake. A GRM of 12 might be a fantastic deal in a high-demand, appreciating pocket of Los Angeles, but it could be a massive red flag in a slower market. The only way to know is to benchmark the number against comparable properties in the exact same submarket.
This is where you stop being a calculator and start being a detective.
- Round Up the Comps: Find recently sold, similar rental properties in the neighborhood. Dig up their sale prices and realistic rental incomes.
- Run Their Numbers: Calculate the GRM for each of those comps. This gives you a baseline range for that specific area.
- See Where You Land: Now, compare your target property. Is its GRM way higher, lower, or right in the middle of the pack?
This process is what separates a simple calculation from real strategic analysis. It tells you if a property is an outlier—either overpriced or a potential bargain—for its specific location.
What the Numbers Are Really Telling You
Once you have that local context, the GRM starts talking. A property with a GRM well below the neighborhood average might signal a hidden gem, an undervalued asset with strong cash flow potential just waiting to be snapped up. On the flip side, a GRM that’s soaring above its peers could mean the seller is asking for a premium that the rent checks just can’t justify.
This is where you start asking the real questions:
- Why is the GRM so low? Is it a motivated seller, or does the place need a gut renovation that will demolish your returns?
- Why is it so high? Is there a legitimate reason, like recent high-end upgrades or zoning that allows for future development?
Investor Takeaway: A property’s GRM is a conversation starter, not the final word. It’s the data point that forces you to dig deeper into the why behind the number.
Ultimately, context is king. For a lot of investors, a GRM under 10 screams “buy”—like that $2 million property pulling in $320,000 in annual rent, clocking in at a sweet 6.25. But if a property’s GRM creeps over 15, many would walk away unless it’s a unique luxury play with obvious upside. You can dive deeper into these industry benchmarks from experts who track these trends.
Learning to read these signals transforms you from someone who just runs numbers into an investor who actually spots true opportunity.
Comparing GRM to Other Key Investment Metrics
A smart investor never relies on a single tool to make a big decision. While the Gross Rent Multiplier is your go-to for a quick first look, it’s just one piece of a much larger puzzle. To truly understand a property’s potential, you need to see how GRM stacks up against other essential metrics.
Think of it like this: GRM is your scout, sent ahead to quickly survey the terrain. But for the main mission, you need the full squad. The two other heavy hitters in your toolkit are the Capitalization (Cap) Rate and Cash-on-Cash Return. Each one tells a different part of the investment story.
GRM vs. The Cap Rate
The biggest difference between GRM and Cap Rate is one simple but critical word: expenses.
GRM completely ignores them for the sake of speed, while the Cap Rate puts them front and center. The Cap Rate is calculated using a property’s Net Operating Income (NOI), which is your gross rent minus all your operating costs. This makes the Cap Rate a much more refined measure of profitability.
GRM skips the details for a quick gut check—perfect for when you’re sorting through dozens of listings before committing to a deep dive. For example, in LA’s robust market, some luxury estates might have a GRM of 18+. Our data-driven approach at ACME flags deals with a GRM under 10 in areas like Hollywood, similar to that attractive 6.25 GRM multifamily we looked at.
If you want to get a better handle on the numbers behind this important metric, you can explore our detailed guide on what is Net Operating Income. It’s the engine that powers the Cap Rate calculation.
Cash-on-Cash Return: The Personal Bottom Line
Then there’s the Cash-on-Cash Return. This metric gets personal because it answers the most important question for many investors: “How hard is my money working for me?” It measures the annual pre-tax cash flow relative to the total amount of cash you actually invested out of pocket.
This is crucial because it accounts for your financing. Two investors could buy identical properties, but if one paid all cash and the other used a loan, their Cash-on-Cash returns would be wildly different.
Investor Insight: GRM is for quick market comparisons, Cap Rate is for property-level profitability, and Cash-on-Cash Return is for measuring your personal investment performance.
Here’s a simple table to break down the key differences between these powerhouse metrics. It’s a handy cheat sheet for knowing which tool to pull out of your belt and when.
Investor Metrics: GRM vs. Cap Rate vs. Cash-on-Cash Return
| Metric | What It Measures | Key Advantage | Key Limitation |
|---|---|---|---|
| Gross Rent Multiplier | The relationship between a property’s price and its gross income. | Incredibly fast and simple for high-level comparisons. | Ignores all operating expenses and financing details. |
| Cap Rate | A property’s potential rate of return based on its income, excluding debt. | A more accurate profitability snapshot by including expenses. | Doesn’t account for mortgage payments or financing structure. |
| Cash-on-Cash Return | The return on the actual cash you invested out of your own pocket. | Highly personalized; shows how your specific deal structure performs. | Can be misleading if a property has very little equity. |
Using all three metrics together gives you a multi-faceted view of any investment. Start with GRM to filter a long list of properties, then use Cap Rate to analyze the most promising ones. Finally, run the Cash-on-Cash Return to see how a deal fits your personal financial strategy.
The Limits of GRM: When to Dig Deeper
Every tool in an investor’s toolkit has its perfect job, and the Gross Rent Multiplier is no different. Think of it as a quick snapshot—it’s brilliant for getting the big picture fast. Its real power is in its simplicity and speed, making it the ideal weapon for that first chaotic stage of a property search.
When you’re staring down a list of ten potential properties, running a full financial analysis on each one is a soul-crushing task. Instead, you can whip out the GRM to rapidly compare similar properties in the same market, instantly flagging which ones are priced better relative to the rent they bring in. It’s your first-pass filter, helping you separate the contenders from the pretenders in minutes.
The Big Blind Spot: Operating Expenses
But here’s the catch: GRM’s greatest strength—its simplicity—is also its most dangerous weakness. By design, the calculation completely ignores operating expenses. This is a massive blind spot that can be seriously misleading if you rely on GRM alone to make a final call.
Key Takeaway: The GRM doesn’t see property taxes, insurance, leaky roofs, or vacancies. It only sees the top-line rent, which is never the money you actually put in your pocket.
Because it overlooks these critical costs, the GRM can’t tell you a thing about a property’s true profitability or cash flow. It’s a measure of potential, not a guarantee of performance. That’s why you have to know when to put this tool down and pick up a scalpel for a closer look.
Why Identical GRMs Can Tell Viciously Different Stories
Let me show you what I mean with a real-world scenario. Imagine two nearly identical duplexes for sale in the same Los Angeles neighborhood. They’re both priced at $1,000,000 and both generate $80,000 in gross annual rent.
- Property A GRM:
$1,000,000 / $80,000 = 12.5 - Property B GRM:
$1,000,000 / $80,000 = 12.5
On the surface, they look like the exact same deal. A rookie investor might just flip a coin. But a savvy one knows it’s time to start digging.
After a little research, you discover the truth:
- Property A: It’s a newer build with low maintenance needs. The tenants pay their own utilities, and the property taxes are lower. Its total annual operating expenses are just $20,000.
- Property B: It’s an older building with a tired roof, a shared water bill the owner pays, and higher insurance premiums. Its annual operating expenses are a whopping $45,000.
Suddenly, the picture snaps into focus. Property A nets $60,000 a year, while Property B only nets $35,000. Despite having the same GRM, Property A is dramatically more profitable. This is exactly why you must move beyond GRM to a deeper analysis of the numbers that actually matter. To see the full financial picture, check out our guide on how to calculate return on investment property.
Ultimately, GRM is the tool that helps you decide which properties even deserve your time. It’s a fantastic filter, but it’s never the final word.
Taking Your Investment Strategy from Good to Great with ACME Real Estate
So you’ve wrapped your head around the Gross Rent Multiplier. That’s a massive first step, but let’s be honest—turning raw numbers into a real, cash-flowing portfolio is where the game is truly played. Think of the GRM as your initial filter, the tool that helps you spot a flicker of potential in the crowded, often overwhelming, Los Angeles market. It’s where every serious investor starts, but it’s definitely not where they finish.
This is the point where theory gets its hands dirty. At ACME Real Estate, we take that initial GRM analysis and build it into a professional-grade strategy. We go way beyond simple metrics, layering on our deep, street-level knowledge of LA neighborhoods and sophisticated tools to uncover the real story hiding behind the numbers.
From a Quick Calculation to a Closed Deal
Your real estate journey might kick off with a calculation, but it succeeds when you have a trusted expert in your corner. We’ve designed our process to protect your interests and squeeze every last drop of potential out of your investment, every single step of the way.
- Beyond the GRM: We’re digging into the nitty-gritty—operating expenses, historical vacancy rates, and local market trends—to paint a complete financial picture, not just a snapshot.
- Deep Due Diligence: Our team helps you navigate the minefield of inspections, title reports, and tenant histories. No surprises, no last-minute curveballs.
- Expert Negotiation: We come to the table armed with data-driven insights to lock in favorable terms, ensuring your investment starts on the most solid ground imaginable.
Our track record speaks for itself: GRM-guided purchases can lead to much faster appreciation when the right follow-up analysis is in the mix. Whether you’re a seller looking to cash in at a market peak or a buyer laser-focused on building a bulletproof portfolio, this metric is your launchpad. To see how a detailed approach can really move the needle, check out these findings on the gross rent multiplier on quickenloans.com.
The ACME Advantage: We don’t just find properties; we build strategies. We translate that initial GRM into a comprehensive plan that lines up perfectly with your long-term financial goals. We turn stats into success stories.
Moving from a quick calculation to a full-fledged investment strategy requires a 360-degree view of the market. To really round out your property investment playbook and get insights that go far beyond GRM, you might want to seek out additional expert investor-focused advice. Partnering with a team that lives and breathes the Los Angeles market is what transforms a good start into a great investment.
Ready to turn your understanding of the Gross Rent Multiplier into a powerful, portfolio-building weapon? The team at ACME Real Estate is here to guide you from that first analysis all the way to closing day. Let’s build your Los Angeles portfolio together. Visit us at https://www.acme-re.com to get started.
 ACME Real Estate | Los Angeles Boutique Real Estate Brokerage