If you think commercial real estate analysis is just about plugging numbers into a spreadsheet, you’re missing the real story. It’s the framework that separates a calculated investment from a blind gamble. It’s how you dig into a property’s income potential and appreciation, looking at market conditions, the property’s real financials, and all the things that could go wrong.
This isn’t just about validating a purchase price. It’s about building the confidence to dissect any deal that lands on your desk and turning raw data into a real-deal strategy.
Moving Beyond Spreadsheets in CRE Analysis

Forget the dry theory. Real-world analysis is about uncovering the story behind the numbers, not just crunching them. It’s a mindset that helps you confidently dissect market climates, property performance, and future potential with genuine insight.
Think of this as your foundational playbook. We’re going to demystify the core components that separate savvy investors from the amateurs who get left holding the bag.
The Modern CRE Landscape
Let’s be real, the global commercial real estate (CRE) market is facing some serious headwinds. Property values have taken a hit, with a 7% drop in the last 12 months alone and a painful 20% decrease over the past two years.
But here’s the twist: despite the downturn, a staggering 88% of surveyed CRE executives expect revenue growth. That tells you there’s a deep-seated resilience in this sector. This isn’t a time for panic; it’s a time for precision. A rock-solid analysis framework is more critical than ever. Success is no longer just about finding a property—it’s about understanding the forces shaping its value today and tomorrow.
A solid analysis does more than just validate a purchase price—it reveals the operational levers you can pull to increase value and the external risks you need to mitigate. It’s your strategic blueprint for the entire investment lifecycle.
Core Pillars of CRE Analysis
A thorough analysis really comes down to three key pillars. Get these right, and you’ll have a 360-degree view of any opportunity.
- Market Intelligence: This is about knowing the ground truth. You need to understand the economic drivers, demographic shifts, and supply-and-demand dynamics of a specific city and even the neighborhood. Who’s moving in? What businesses are growing? What’s the vibe?
- Property Financials: Here’s where you get your hands dirty with the numbers. You’re scrutinizing rent rolls, digging into operating expenses, and pressure-testing income projections to find a property’s true profitability.
- Risk Assessment: Every investment has risks. A proper analysis doesn’t ignore them—it quantifies them. You need to account for everything from potential tenant vacancies and interest rate hikes to surprise capital expenditures.
If you’re still wrestling with spreadsheets, you’re already behind. To really nail this, look into specialized real estate investment management software that can centralize your operations and investor capital. By integrating these pillars, you stop being a passive number-cruncher and become an active strategist, ready to make decisions with real confidence.
Mastering Market and Submarket Intelligence

Every killer deal starts with a deep, almost obsessive, understanding of the playground. A proper commercial real estate analysis goes way beyond surface-level data to find a market’s true pulse. It’s about reading the tea leaves of demographic shifts, economic drivers, and new development pipelines.
Think of yourself as a detective. Your job is to uncover the real story of a location. Is this a city on the rise, fueled by new jobs and an influx of people? Or is it a market coasting on old momentum that’s about to fade?
Digging into the Economic DNA
The health of a local economy is the number one driver of commercial real estate performance. A rising tide of job growth lifts all boats—filling up office buildings, warehouses, and retail centers.
Start by figuring out what makes the local economy tick. Is it a tech hub, a logistics center, a healthcare powerhouse, or a tourism hotspot? Each industry has different real estate needs and its own boom-and-bust cycles. A city with a diverse mix of industries, for example, is way more resilient during a downturn than a town that relies on a single employer.
To get the real story, you need to look for a few key signals:
- Job Growth Rate: Is the area adding jobs faster than the national average? You’re looking for consistent, diverse job growth. That’s a powerful sign.
- Major Employers: Who are the big players? Are they expanding, or are there rumors of layoffs? The fortunes of a city’s top employers will hit property demand directly.
- Unemployment Trends: A declining unemployment rate signals a strong labor market. That usually translates to higher consumer spending and business confidence.
This isn’t just about abstract numbers. A new manufacturing plant announcement might signal future demand for industrial space and workforce housing, creating a ripple effect you can capitalize on.
The most profitable opportunities are often found in the gap between perception and reality. While everyone else is chasing yesterday’s hot markets, a deep submarket analysis helps you find tomorrow’s winners before they hit the mainstream.
Tracking the Human Element: Demographics and Demand
People are the lifeblood of real estate. Where they choose to live, work, and spend money determines whether a commercial property sinks or swims. This is where you dig into the “who” behind the demand.
Are young professionals flooding the urban core, driving demand for trendy apartments and experiential retail? Or is a suburb seeing a baby boom, signaling a future need for family-oriented services and bigger retail spaces?
The global commercial real estate industry has ballooned into a $5.8 trillion market, fueled by a 3.2% compounded annual growth rate over the last five years. A lot of that growth comes from capital chasing these exact demographic and economic shifts into new markets.
A key metric I always watch is the absorption rate, which tells you how fast available commercial space is being leased. A high absorption rate points to strong demand, which almost always leads to rising rents and property values. You can learn more about how to interpret the absorption rate in real estate to get a better handle on the supply and demand dynamics in your target submarket.
To truly understand a market, you need to look beyond the spreadsheet. This table breaks down the essential metrics I use and what they actually tell me about an investment’s potential.
Key Market Analysis Metrics
| Metric | What It Measures | Why It Matters For Your Analysis |
|---|---|---|
| Population Growth | The net change in a market’s population over a specific period. | A growing population fuels demand for all property types—housing, retail, office, and industrial. It’s a foundational indicator of a healthy market. |
| Job Growth | The rate at which new jobs are being created in the local economy. | Strong job growth, especially in diverse, high-wage sectors, increases household income and consumer spending, directly benefiting retail and multifamily properties. |
| Median Household Income | The average income level of households in the area. | This metric indicates the purchasing power of the local population, which is critical for analyzing retail properties and luxury apartments. |
| Vacancy Rate | The percentage of all available units in a specific commercial property type that are unoccupied or not rented. | A low or declining vacancy rate signals strong demand and gives landlords leverage to increase rents. A high rate is a major red flag. |
| Absorption Rate | The rate at which available commercial space is leased over a given period. | This tells you how quickly the market is “absorbing” new supply. A high absorption rate is a strong positive signal for future rent growth. |
| New Construction Pipeline | The amount of new commercial space that is currently under construction or planned for development. | An oversupply of new construction can flood the market and drive down rents. You need to know what’s coming down the pike. |
Think of these metrics as the vital signs of a market. By tracking them together, you can build a clear, data-backed picture of where the opportunities—and the risks—truly lie.
Real-World Scenario: Industrial vs. Retail Analysis
To see how this works in practice, let’s compare two completely different scenarios.
Scenario A: Industrial Property in a Logistics Hub
Imagine you’re analyzing a warehouse near a major port like Long Beach, CA. Your focus is going to be completely different than if you were looking at a retail space. You’d be zeroing in on:
- Proximity to ports, major highways, and rail lines.
- Vacancy rates for industrial space and the pipeline of new warehouse construction.
- Growth in e-commerce and third-party logistics (3PL) companies in the region.
- Local labor availability for warehouse and distribution jobs.
Scenario B: Retail Space in a Growing Sunbelt City
Now, picture a retail strip center in a booming suburb of Phoenix, AZ. Your focus shifts dramatically. You’re now looking at:
- Median household income and disposable income trends in the immediate 5-mile radius.
- Traffic counts on the adjacent roads and visibility from the street.
- The mix of nearby residential developments (single-family homes vs. apartments).
- Competition from other retail centers and the health of anchor tenants in the area.
In both cases, the core principles are the same, but the specific data points you prioritize are tailored to the property type and its unique demand drivers. This is what separates a generic analysis from a powerful investment thesis.
Underwriting Key Metrics: The Investor’s Toolkit
If market analysis is the detective work, underwriting is where you build the case. This is where the story of a property ends and the cold, hard numbers begin. It’s the heart of any real commercial real estate analysis.
Think of it as the investor’s toolkit—a set of financial metrics that, when used together, paint a brutally honest picture of a deal’s potential. This isn’t just about verifying the seller’s math; it’s about tearing it apart and rebuilding it based on reality. A seller’s proforma is a sales pitch, not gospel. Your job is to scrutinize every line item, spot the inflated income, and uncover the hidden expenses that sink deals.
Let’s get into the essentials.
Decoding Net Operating Income: The Foundation of Value
Everything starts with Net Operating Income (NOI). It’s the single most important metric because it tells you how profitable a property is before you even think about loans or taxes. It’s the pure, unadulterated cash flow the asset generates from its operations.
The formula is simple:
NOI = Effective Gross Income (EGI) – Operating Expenses
But the devil is in the details. EGI isn’t just the total potential rent; it’s what you actually collect after accounting for vacancies and credit losses. Operating expenses include everything from property taxes and insurance to maintenance and management fees. Critically, NOI excludes debt service (your mortgage), capital expenditures, and income taxes. This distinction is crucial for getting a true sense of the property’s operational health.
The Capitalization Rate: The Market’s Quick Read
Once you have a reliable NOI, you can calculate the Capitalization Rate (Cap Rate). This is a quick-and-dirty metric that helps you compare the potential return of different properties on an apples-to-apples basis. It tells you the unleveraged rate of return you’d get if you bought the property with all cash.
Cap Rate = Net Operating Income (NOI) ÷ Property Value
A lower cap rate usually means a higher property value and lower perceived risk (think a Class A office building in a prime location). A higher cap rate suggests a lower price tag but potentially higher risk or more work. For example, a property with a $100,000 NOI priced at $1,500,000 has a 6.67% cap rate.
Cap rates are a fantastic starting point, but they don’t tell the whole story, especially once you add financing to the mix. To really underwrite an investment, you need to understand different valuation methodologies. A good place to start is with Income-Based Valuation methods.
Don’t fall in love with a high cap rate without understanding why it’s high. It could signal a fantastic opportunity, or it could be a warning sign of a distressed asset, a sketchy area, or a seller using wildly optimistic numbers.
Cash on Cash Return: Your Wallet’s Perspective
While cap rate ignores financing, Cash-on-Cash Return puts it front and center. This metric tells you exactly how much cash you’re getting back each year relative to the actual cash you invested out-of-pocket (your down payment plus closing costs).
It’s calculated as:
Cash-on-Cash Return = Annual Pre-Tax Cash Flow ÷ Total Cash Invested
This is the number that really matters to your bank account. If you put $500,000 of your own money into a deal and your annual pre-tax cash flow (after paying the mortgage) is $40,000, your cash-on-cash return is 8%. It directly measures the performance of your equity.
Internal Rate of Return: The Long Game
Finally, there’s the Internal Rate of Return (IRR). This is the most complex of the core four, but it’s arguably the most powerful tool in your analysis. Unlike the other metrics that offer a snapshot in time, IRR considers the entire investment lifecycle.
IRR is the annualized rate of return that accounts for all cash flows over your entire holding period—your initial investment, the annual cash flows (which will change year to year), and the final profit from the sale. It’s a dynamic metric that factors in the time value of money, recognizing that a dollar today is worth more than a dollar five years from now.
A deal with a projected 15% IRR is expected to deliver an average annual return of 15% over its lifetime, factoring in every dollar in and every dollar out. It helps you compare deals with different hold periods and cash flow patterns, giving you a much more complete picture of an investment’s total return.
Understanding these metrics is fundamental, but they’re just one part of the broader discipline of property valuation. For a deeper dive, our guide on commercial property valuation methods provides a more complete framework.
By mastering these four key metrics—NOI, Cap Rate, Cash-on-Cash, and IRR—you move from being a passive observer to an active analyst, equipped to dissect any deal and make decisions with confidence.
Building Your Proforma and Stress-Testing the Deal
Once you’ve wrestled with the key metrics, it’s time to build your financial crystal ball: the proforma. Think of it less like a static spreadsheet and more like a dynamic story of the property’s financial life over your entire hold period, usually five to ten years. A good proforma maps out everything—from income growth and vacancy dips to every single operating expense.
But here’s the real secret: a proforma is only as good as the assumptions you plug into it. The skill isn’t just in building the model; it’s in knowing how to break it. This is where you shift from wishful thinking to bulletproofing your investment.
This simplified flow shows how income and expenses get boiled down to determine a property’s value during underwriting.
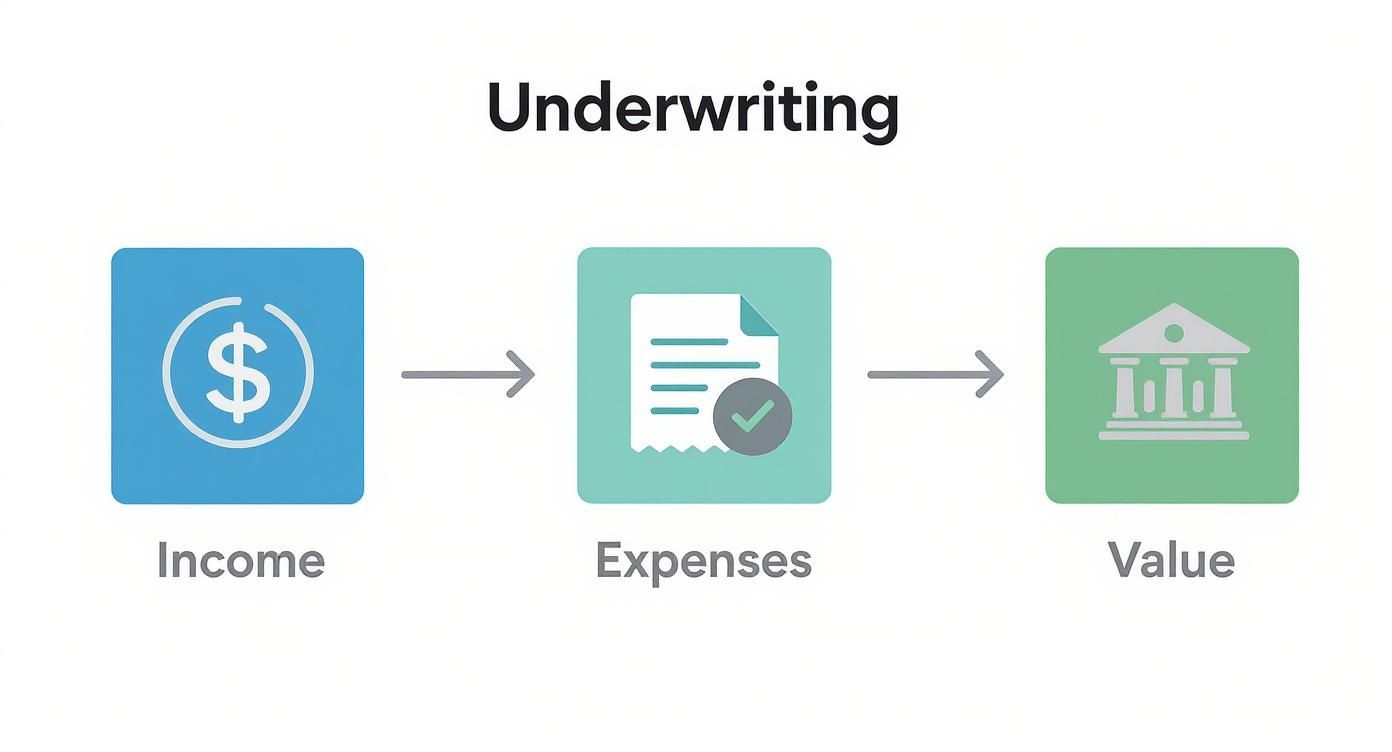
As you can see, an accurate valuation is the direct result of meticulously projecting income while keeping a tight rein on expenses. That’s the entire game.
Crafting Projections That Aren’t Just Wishful Thinking
Building a solid proforma means forecasting both sides of the ledger: income and expenses. This is where you blend the property’s historical performance with some serious, forward-looking market intelligence.
On the income side, you need to project:
- Rental Growth: Be brutally realistic. A standard 3-5% annual rent bump sounds nice, but is it actually happening in your specific submarket for this property type? Dig into local rent comps, economic forecasts, and what other landlords are really getting.
- Vacancy Rates: Never, ever assume 100% occupancy. It doesn’t exist. Look at the building’s historical vacancy and the current market average. I always build in a buffer for tenant turnover, lease-up periods, and the inevitable economic hiccups.
- Other Income: Don’t leave money on the table. Account for ancillary revenue from things like parking fees, laundry facilities, or storage units. It all adds up.
For expenses, you’ll forecast property taxes, insurance, utilities, maintenance, and management fees. One of the most common rookie mistakes is underestimating capital expenditures (CapEx)—the big-ticket items like a new roof or an HVAC system that can wipe out your cash flow. Always set aside a healthy replacement reserve.
The Art of the Stress Test
Got your proforma built? Great. Now it’s time to play devil’s advocate. This is where you run a sensitivity analysis to see how your returns hold up when things inevitably go sideways. What happens to your cash flow and IRR if your rosy assumptions turn out to be just a little too optimistic?
A proforma isn’t meant to predict the future with perfect accuracy. Its true value is in shining a spotlight on a deal’s weakest links. Stress-testing is how you quantify that risk and prepare for it.
Start asking a series of “what if” questions and run the numbers for each scenario:
- Market Shock Scenario: What if the biggest employer in town packs up and leaves, and your vacancy rate spikes to 20%? Does the deal still breathe?
- Interest Rate Scenario: Your variable-rate loan is up for renewal. How does your cash-on-cash return look if rates jump by 2%?
- Expense Shock Scenario: What if property taxes get reassessed and shoot up by 15% in year two?
By modeling these downside scenarios, you start to identify your break-even points. You might find that the deal cash flows just fine with a 15% vacancy rate but sinks into the red at 20%. This gives you a clear, tangible understanding of your margin for error.
Don’t Forget Sector-Specific Headwinds
Different property types face completely different challenges, and your proforma needs to reflect that reality. Take the industrial sector, for example. After a massive, post-pandemic boom, we’re seeing some signs of cooling.
Net absorption in industrial properties recently plummeted by 39% year-over-year to a decade-low. Why? Because new construction outpaced demand by a ratio of roughly 4-to-1, pushing vacancy rates up to 7.4%. If you want to dig deeper, you can explore the latest commercial real estate market insights yourself. This is exactly the kind of data you need to make defensible vacancy and rent growth assumptions in an industrial deal proforma today.
Building and then pressure-testing a proforma is the final, most critical gut-check in your analysis. It transforms your underwriting from a static calculation into a living, breathing decision-making tool—giving you the hard data and conviction you need to move forward, renegotiate, or walk away.
Navigating Due Diligence to Close with Confidence
So, your analysis checks out. The proforma holds up under pressure, and the numbers are telling you a great story. Congratulations—you’ve made it past the initial hurdles. Now it’s time to face the final boss: due diligence.
This isn’t just a formality. It’s your last, best chance to find any skeletons in the closet before you sign on the dotted line. Think of it as a full-body scan of the property where you verify every single assumption you’ve made, uncover any hidden liabilities, and confirm that the deal is exactly what it appears to be.
Getting this right protects your capital. More importantly, it gives you the leverage to renegotiate terms or, if necessary, confidently walk away from a deal that’s about to go south.
The Holy Trinity of Due Diligence
A thorough investigation always boils down to three core areas: the physical asset, the legal paperwork, and the financial records.
Neglecting any one of these is like flying a plane after only checking two of the three engines. You have to scrutinize each with the same intensity. This is where your spreadsheet models meet the gritty reality of a physical building with a real history. It’s a process that demands an almost obsessive attention to detail.
Kicking the Tires: The Physical Inspection
No amount of slick financial modeling can make up for a crumbling foundation or an ancient HVAC system. The physical due diligence phase is all about understanding the property’s true condition and sniffing out any surprise capital expenditures lurking around the corner.
Your inspection checklist needs to be exhaustive:
- Structural and Systems Review: Get qualified engineers in there. They need to assess the building’s structural integrity, the roof’s condition, elevators, plumbing, electrical, and HVAC systems. A surprise $150,000 roof replacement can absolutely decimate your first few years of cash flow.
- Environmental Site Assessment (ESA): A Phase I ESA is non-negotiable. It digs into the property’s past to identify potential contamination from things like old underground storage tanks or hazardous materials. Uncovering an environmental issue after closing can lead to staggering cleanup costs and legal nightmares.
- Accessibility and Code Compliance: Is the property up to current building codes and regulations? A building that isn’t compliant can trigger expensive, mandatory upgrades you didn’t budget for.
Due diligence is where the seller’s story gets fact-checked. Assume nothing, verify everything. A small discrepancy found here can save you from a massive headache later.
Untangling the Legal Web
The legal deep dive is where you ensure you’re getting a clean title and that the property can actually be used the way you intend. This is when you bring in the legal eagles to pore over every document that governs the property’s ownership and rights.
Key documents to get your hands on include:
- Title Report: This is critical. It reveals any liens, encumbrances, or ownership claims against the property. A “cloudy” title can put your entire ownership at risk.
- Survey: An up-to-date survey confirms property lines, identifies any easements, and makes sure there are no encroachments from neighboring properties.
- Zoning and Land Use: You have to confirm that the property’s current use is permitted under local zoning ordinances and that your business plan won’t violate any regulations. Never assume you can convert an office building to apartments without verifying the zoning first.
The Financial Forensics Audit
Finally, it’s time to audit the property’s financial lifeblood. This means going way beyond the seller’s proforma and digging into the actual, historical operating data. Your goal is to verify the income and expose any conveniently understated expenses.
Start by creating lease abstracts for every single tenant. This summary document captures key terms like rent, expiration dates, renewal options, and expense reimbursements. It’s the only way to confirm the rent roll the seller gave you is accurate. You’ll also need to scrutinize every single service contract—from landscaping to security—to understand the true operating expenses.
This entire process is a mission-critical part of your investment journey. To help you stay organized, we’ve built a detailed guide that breaks it all down. You can explore our comprehensive commercial real estate due diligence checklist to ensure you cover all your bases. Approaching this final phase with a systematic, almost paranoid level of detail is what separates a successful closing from a costly mistake.
Getting Straight Answers to Your Toughest CRE Questions
Even after you’ve run the numbers, the world of commercial real estate analysis is full of nuance. It’s a minefield of jargon, what-ifs, and billion-dollar questions. Let’s cut through the noise and tackle the questions I hear most often.
Think of this as your back-pocket guide for when you need a straight answer, no fluff.
What’s a Good Cap Rate?
This is the question everyone asks, and the only honest answer is: it depends. It depends on the market, the property type, the asset’s condition, and frankly, your own stomach for risk.
A 4% cap rate might be a home run for a brand-new, fully leased apartment building in a prime neighborhood. But an 8% cap rate on an old, beat-up retail center in a struggling suburb? That’s not a deal; it’s a distress signal.
Stop hunting for a magic number. Instead, start thinking of the cap rate as a risk thermometer.
- Low Cap Rates (4-6%): This usually means lower risk. You’re looking at higher-quality assets in vibrant locations with tenants who actually pay their rent. The trade-off is you’re paying a premium, so your initial cash flow will be thinner.
- High Cap Rates (8%+): This signals higher risk. You’re likely dealing with an older property, a challenging location, or a management nightmare waiting to happen. The potential reward is much higher cash flow—if you can pull the property out of its nosedive.
A “good” cap rate is just one that pays you enough for the headaches you’re about to inherit.
How Much Cash Do I Actually Need for a Commercial Deal?
First, forget everything you know about residential loans. That 3.5% down payment isn’t happening here. Commercial lenders play in a different league, and they are far more conservative.
You should expect to bring a serious pile of cash to closing, typically somewhere between 25% and 35% of the purchase price.
On a $1 million property, that means you’re writing a check for $250,000 to $350,000 just for the down payment.
But that’s not the whole story. You also need to budget for closing costs, appraisals, legal fees, and a “sleep-at-night” fund for when the HVAC inevitably dies. I tell my clients to have an extra 3-5% of the purchase price ready to cover these extras.
Should I Use an Interest-Only Loan?
An interest-only (IO) loan can feel like a superpower, but it’s a double-edged sword. For the first few years, your payments are incredibly low because you’re only covering the interest. This is a massive advantage on a value-add project where every dollar of cash flow needs to be pumped back into renovations.
Here’s the catch. When that IO period ends, your payment will jump—sometimes dramatically—as you start paying down the principal. If you haven’t jacked up the rents or increased the property’s income like you planned, you could find yourself in a world of hurt.
My advice? Use IO loans surgically. They’re for short-term, value-add plays where you have a rock-solid plan to boost NOI before the loan resets. For a stabilized building you plan to hold for the long haul, a traditional amortizing loan is almost always the smarter, safer bet.
Is IRR More Important Than Cash-on-Cash Return?
This is like asking if an engine is more important than the wheels. You need both, but they do different jobs.
Here’s how I think about it:
- Cash-on-Cash Return: This is your “right now” number. It tells you how much cash your initial investment is spitting out each year. It’s the metric that keeps the lights on and pays your investors.
- Internal Rate of Return (IRR): This is your “big picture” number. It’s the metric that builds real wealth, measuring the total performance of the deal over its entire life, including the profit you make when you sell.
An investor who needs immediate passive income is going to obsess over cash-on-cash. But an opportunistic investor playing the long game might sacrifice early cash flow to chase a massive IRR at the exit. A truly bulletproof analysis looks at both.
At ACME Real Estate, we believe a killer deal starts with a killer analysis. Our team lives and breathes this stuff, providing the kind of data-driven insights you need to move with confidence in the Los Angeles market. Ready to find your next opportunity? See what LA has to offer at https://www.acme-re.com.