At its core, a real estate investment calculator is a digital tool that slashes through the noise to analyze a property’s true profit potential. It takes the critical financial data—purchase price, loan details, operating costs—and spits out the metrics that actually move the needle, like cash flow, cap rate, and cash-on-cash return. Think of it as your financial co-pilot, designed to kill the guesswork and empower you to make ridiculously smart investment decisions.
Why Gut Feelings Are Your Wallet’s Worst Enemy

Let’s be brutally honest: buying property is an emotional minefield. It’s way too easy to fall in love with a building’s vintage charm or get swept up in the hype of an “up-and-coming” neighborhood. But in the cutthroat world of real estate investing, running on emotion is a one-way ticket to financial regret. The pros separate themselves from the amateurs by trading fuzzy feelings for cold, hard data.
This is precisely where a real estate investment calculator becomes your MVP. It’s the unfiltered, unbiased truth-teller that exposes a property’s real potential—or its hidden financial disasters.
Shifting from Hope to Hardcore Strategy
The whole game is about shifting your mindset from, “Man, this feels like a good deal,” to, “The numbers prove this is a smart investment.” A calculator forces you to confront the facts your gut would rather ignore.
- Objective Analysis: It rips away the nice staging and fresh paint to focus on the one thing that truly matters: the property’s raw ability to make you money and build long-term wealth.
- Risk Mitigation: This is everything. You can stress-test different scenarios before you ever sign on the dotted line. What if vacancy rates spike? What if the HVAC gives up the ghost? A calculator reveals just how resilient—or fragile—your investment really is.
- Confident Decisions: When you’re armed with undeniable data, you negotiate from a position of strength, walk into a bank with swagger, and sleep a lot better knowing your choices are backed by solid math.
This data-driven approach has never been more critical. We’re seeing persistent uncertainty in global real estate markets, driven by everything from geopolitical tension to shifting economic policies. This just underscores how crucial detailed asset analysis is for any serious investor. You can learn more about navigating today’s real estate market on jll.com.
Ultimately, a good calculator transforms uncertainty into a calculated advantage. It’s not just about crunching numbers; it’s about building a predictable, profitable real estate empire from your very first deal.
Assembling Your Financial Arsenal
Before you can unleash a real estate investment calculator, you need the right ammunition. The calculator is a beast of an engine, but it runs on data. Feeding it vague, optimistic, or just plain wrong numbers is the fastest way to get a dangerously misleading result.
As the old saying goes: garbage in, garbage out.
Let’s get your financial data locked and loaded. We’re moving beyond the obvious to build a complete, brutally realistic picture of a potential deal. This is your pre-flight checklist to make sure every calculation is grounded in reality, not fantasy.
Before diving in, here’s a quick checklist of the essential data points you’ll need to pull together. Think of this as your cheat sheet for building an accurate analysis from the ground up.
Essential Data Checklist for Your Calculator
This table breaks down the key inputs, explaining what each one is and where you can find the most reliable information.
| Input Category | What It Is | Where to Find It |
|---|---|---|
| Purchase & Financing | The total initial cash and loan needed to acquire the property. | Your offer, lender pre-approval, quotes from contractors. |
| Operating Income | All revenue the property generates, primarily from rent. | Current lease agreements, local market rent comparables (“comps”). |
| Operating Expenses | The ongoing costs required to run and maintain the property. | County tax records, insurance quotes, utility bills, property manager proposals. |
| Capital Expenditures | Funds set aside for major, infrequent replacements (e.g., roof, HVAC). | Property inspection report, your own long-term budget. |
With this framework in mind, let’s get into the nitty-gritty of gathering these numbers.
Beyond the Listing Price
The number on the Zillow page is just the starting line. Your true initial investment is a much bigger story, and overlooking these details can derail your analysis before you even begin.
Here’s what you absolutely have to nail down:
- Purchase Price: This is the big one, but remember it’s your offer price, not necessarily the list price.
- Down Payment: The percentage of the purchase price you’re paying out-of-pocket. This directly impacts your loan amount and, ultimately, your cash-on-cash return.
- Closing Costs: This is where so many new investors get wrecked. Budget 2-5% of the purchase price for things like loan origination fees, title insurance, appraisal fees, and attorney costs. Don’t eyeball this.
- Immediate Repair & Rehab Budget: Does that duplex need a new water heater or a fresh coat of paint before a tenant can move in? Get real quotes from local contractors—don’t just guess. This is cash you need on day one.
These initial costs form the “cash invested” part of your key metrics, so getting them right is non-negotiable.
A common mistake is forgetting that your financing details are a massive part of this arsenal. Your interest rate and loan term will determine your monthly mortgage payment, which is often your largest single expense. For a deep dive, check out our complete guide on how to calculate mortgage payments to ensure your numbers are spot-on.
Projecting Your Ongoing Expenses
Once you own the property, the costs don’t stop. A truly useful calculator demands a realistic projection of what it will cost to operate the property month after month, year after year.
Here’s your operational checklist:
- Property Taxes: Don’t just use the seller’s old tax bill. Head to the county assessor’s website for the most current figures. A sale can, and often does, trigger a tax reassessment.
- Homeowners Insurance: Get an actual quote from an insurance agent for a landlord policy. This is different—and usually more expensive—than a standard homeowner policy.
- Utilities: Be crystal clear on this. Which utilities will you cover, and which fall to the tenant? If you can, get your hands on past bills to see real usage.
- Vacancy Rate: No property stays occupied 100% of the time. Period. A conservative estimate is typically 5-10% of the gross annual rent, depending on your local market’s demand.
- Repairs & Maintenance: A good rule of thumb is to budget 1% of the property’s value annually. If it’s an older property with a questionable roof, you might want to bump that up.
- Property Management Fees: If you’re not managing it yourself, expect to pay 8-12% of the monthly rent to a professional. Don’t forget this if you plan to scale.
- HOA Fees: This is a make-or-break line item for condos or homes in planned communities. Never overlook it.
And while you’re gathering these numbers, don’t forget to account for the crucial tax deductions for real estate investors that can seriously impact your actual net returns.
Armed with this comprehensive data, you’re ready to unlock the true power of your calculator.
Translating the Metrics That Actually Matter

You’ve done the legwork, gathered your financial intel, and plugged it all into your real estate investment calculator. Now, a wall of percentages and dollar signs is staring back at you. This is the moment of truth—turning that raw data into a clear story about a property’s potential.
These aren’t just abstract figures; they’re the vital signs of your deal. Getting fluent in this language is what separates confident, informed investors from people just gambling in the dark. Let’s break down the three core metrics that every serious investor lives and breathes.
Net Operating Income: The Engine of Your Investment
Before we get to the flashy return metrics, we need to talk about the workhorse that powers them all: Net Operating Income (NOI). Think of NOI as the property’s pure, unadulterated profit before you account for your mortgage or income taxes.
The calculation is refreshingly simple:
Total Rental Income – All Operating Expenses = Net Operating Income (NOI)
This number is the bedrock of your analysis. It shows you the property’s fundamental ability to generate profit on its own, completely separate from who owns it or how they financed it. A strong, positive NOI is the first green flag of a healthy investment. To keep your numbers straight and your analysis clean, using a good online financial calculator can make processing all that data much smoother.
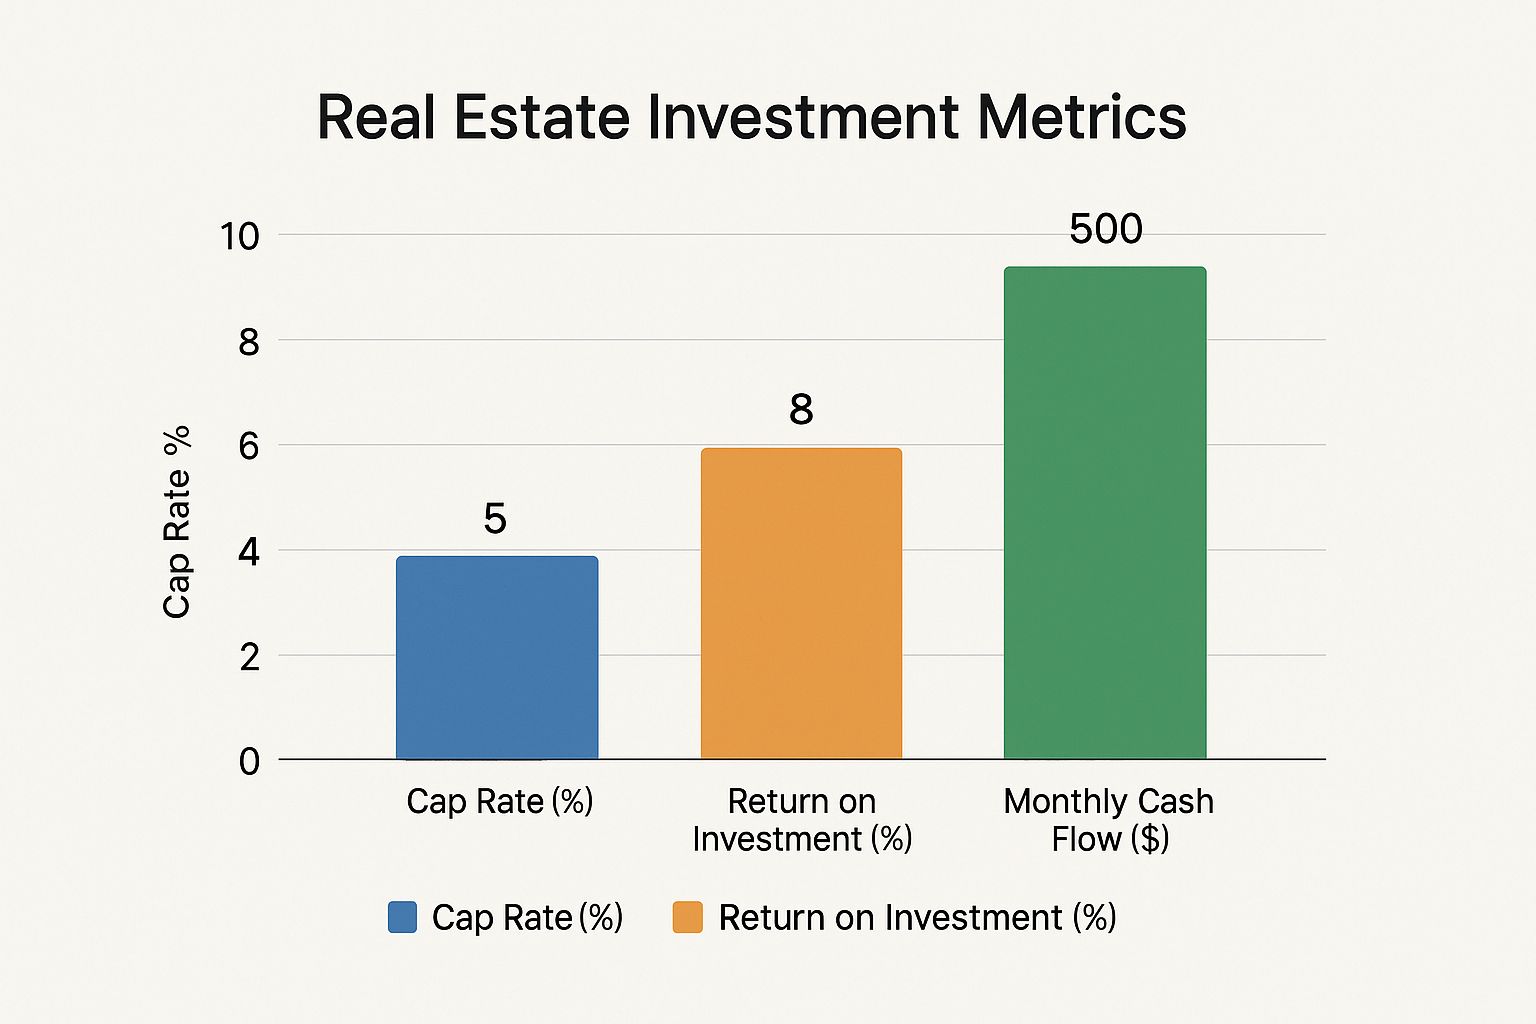
Capitalization Rate: The Property’s Raw Earning Power
The Capitalization Rate, or Cap Rate, is one of the most talked-about metrics in real estate, and for good reason. It measures the property’s raw, unleveraged return as if you bought it with all cash. This is what makes it the ultimate tool for comparing the relative value of different properties, regardless of financing.
Here’s the formula:
NOI / Purchase Price = Cap Rate
For instance, if a property’s NOI is $15,000 and the purchase price is $300,000, the Cap Rate is 5% ($15,000 / $300,000). Generally, a higher cap rate points to a higher potential return, but it often comes with more perceived risk. Nailing the property’s value is critical here; our guide on how to determine home value dives deeper into that process.
A property’s Cap Rate is its heartbeat. It tells you the pure earning potential of the asset itself, stripping away the complexities of your personal financing to give you a clean, apples-to-apples comparison point against other deals on the market.
This metric is your anchor. Even when property values dip, rental growth can stay strong. Knowing a property’s fundamental earning power—its Cap Rate—helps you see its true resilience through market cycles.
Cash-on-Cash Return: Your Personal Profitability
While Cap Rate is all about the property, the Cash-on-Cash Return is all about you. This metric gets right to the point, answering the single most important question for any investor: “For every dollar I pull out of my own pocket for this deal, what percentage am I getting back each year?”
It’s calculated like this:
Annual Pre-Tax Cash Flow / Total Cash Invested = Cash-on-Cash Return
Your Total Cash Invested is everything you bring to the table: your down payment, closing costs, and any cash you spend on immediate repairs. The Annual Pre-Tax Cash Flow is simply your NOI minus your total mortgage payments for the year.
If your total cash invested was $70,000 and your annual cash flow after the mortgage is $7,000, your Cash-on-Cash return is a solid 10% ($7,000 / $70,000). This number is the truest measure of how hard your own money is working for you, making it an essential gauge of your personal return.
Comparing Deals in the Real World: An Investor Showdown
Running numbers on a spreadsheet is one thing. Putting your real estate investment calculator to the test in the wild? That’s where the real magic happens. This is the moment you move from theory to action, comparing distinct opportunities to see which one actually aligns with your goals, your budget, and your stomach for risk.
Let’s stage a classic investor showdown: a stable, turnkey single-family home versus a gritty, high-potential fixer-upper duplex. These are two completely different paths to building wealth, and your calculator is the perfect tool to light the way.
The Chill Suburban Turnkey
Picture a clean, move-in-ready single-family home in a sought-after suburb. It’s priced at $450,000. After gathering your data and plugging it into the calculator, the numbers look something like this:
- Projected Rent: A solid $3,200 per month.
- Rehab Costs: Essentially $0. It’s ready for a tenant on day one.
- Key Metrics: Your calculator spits out a respectable 6% cash-on-cash return and a modest positive monthly cash flow of $350.
The story here is one of stability. The returns aren’t earth-shattering, but neither are the headaches. This is a lower-risk, almost set-it-and-forget-it type of investment, perfect for someone prioritizing passive income and steady, long-term appreciation over a quick home run.
The High-Octane Urban Fixer-Upper
Now, let’s pivot to a duplex in an up-and-coming urban neighborhood. The asking price is lower at $375,000, but it needs a lot of love. Here’s how the inputs shake out in your calculator:
- Projected Rent (Post-Renovation): A hefty $4,500 per month for both units combined.
- Rehab Costs: A significant $60,000 upfront investment.
- Key Metrics: After crunching the numbers, the calculator reveals a powerful 12% cash-on-cash return and a monthly cash flow of $900.
This deal tells a completely different story—one of sweat equity. The upfront capital and effort are much higher, which naturally brings more risk. But the reward is substantially greater, both in monthly cash flow and the potential for forced appreciation you create through the renovation.
This side-by-side comparison is the entire point of using a real estate investment calculator. It transforms two very different properties into a clear, apples-to-apples financial analysis, empowering you to look past the curb appeal and see the real numbers driving each deal.
To really see how these two opportunities stack up, let’s put them head-to-head in a simple table.
Investment Snapshot: Turnkey vs Fixer-Upper
| Metric | Property A (Turnkey SFH) | Property B (Fixer-Upper Duplex) |
|---|---|---|
| Purchase Price | $450,000 | $375,000 |
| Rehab Costs | $0 | $60,000 |
| All-In Cost | $450,000 | $435,000 |
| Monthly Rent | $3,200 | $4,500 |
| Monthly Cash Flow | $350 | $900 |
| Cash-on-Cash Return | 6% | 12% |
The table makes the trade-offs crystal clear. Property B offers double the cash-on-cash return and significantly higher monthly cash flow, but it requires a hefty upfront renovation budget and the project management that goes with it.
As you can see, a higher return on investment doesn’t always correlate directly with the highest monthly cash flow, showcasing why analyzing multiple metrics is critical.
The Verdict Is Yours
So, which property is the “better” investment? The calculator doesn’t give you the answer—it gives you the clarity to answer it for yourself.
If your main goal is to minimize risk and generate passive income with as little active management as possible, the turnkey home is the obvious winner.
But if you have the capital, time, and risk tolerance for a project that promises much higher returns, the fixer-upper duplex is the more compelling opportunity. The calculator just lays the facts bare, allowing you to align a potential deal with your personal financial strategy.
Advanced Analysis for Next-Level Investors
Sure, the basic metrics like cash flow and cap rate are your foundation. You absolutely need to know them. But the real pros—the ones who consistently build wealth in any market cycle—know how to push their real estate investment calculator to its absolute limits.
This is about moving beyond a simple snapshot of today’s numbers. It’s what separates a good investor from a great one. You’re essentially turning your calculator into a dynamic forecasting machine, letting you stress-test your assumptions and see a deal from every conceivable angle.
This kind of deep dive is critical. In the second quarter of 2025 alone, global direct real estate transactions hit around US$179 billion, a 14% year-over-year jump. That tells you just how fast the investment landscape can move. While residential assets are still hot, understanding the specific weaknesses of your deal is what protects your capital when things get turbulent.
Stress-Testing Your Deal with “What If” Scenarios
The first numbers you plug into the calculator are really just your best guess, right? An educated one, hopefully, but still a guess. This is where you play devil’s advocate and purposefully break your own assumptions to see how fragile—or how bulletproof—your investment truly is.
Think of it as a financial fire drill. Use your calculator to model a few different scenarios:
- Interest Rate Hikes: What happens to your cash flow if your mortgage rate jumps by 0.5% or even a full 1%? Does the deal still pencil out, or does it start bleeding cash?
- Vacancy Surges: Let’s say your market averages 5% vacancy. What if a major local employer packs up and leaves, pushing that number to 10%? Are you still in the black, or suddenly in the red?
- Rent Stagnation: Everyone projects rent growth. But what if it doesn’t materialize for the first couple of years? Does the investment still make sense?
This isn’t about being a pessimist; it’s about being a prepared realist. Any deal can look good in a perfect-world spreadsheet. The one that still holds up under pressure is the one you actually want to own.
The Internal Rate of Return (IRR) is your crystal ball for long-term profitability. Unlike metrics that provide a single-year snapshot, IRR calculates your annualized return over the entire life of the investment, factoring in the initial purchase, annual cash flows, and the final sale proceeds. It’s a more complete measure of a deal’s performance.
Projecting Long-Term Returns
Your calculator isn’t just for analyzing year one. The savviest investors use it to project total returns over a 5 or 10-year holding period, which gives you a completely different perspective.
This means you need to start factoring in variables that play out over time:
- Loan Amortization: How much principal will you have paid down in five years? That’s pure equity you’re building, and it’s a huge part of your total return.
- Annual Rent Increases: Model a conservative 2-3% increase in rent each year to see how your cash flow grows over the hold period.
- Property Appreciation: While it’s never wise to bank on appreciation, modeling a modest annual increase shows you the potential total return when you eventually sell. For a deeper dive into these kinds of projections, check out this guide to using a rental property ROI calculator.
When you combine these future projections, you get a much richer picture of the investment’s real wealth-building power. This level of analysis is a core part of any serious strategy, which is why we’ve put together a thorough real estate due diligence checklist to guide you through the entire process.
Common Real Estate Calculator Questions
Even the slickest real estate investment calculator can leave you with a few head-scratchers. When you’re staring at a screen full of numbers, it’s completely natural for questions to pop up. Let’s tackle the common sticking points and clear the fog so you can analyze your next deal with total confidence.
Think of this as your rapid-fire guide to the questions every single investor asks sooner or later. Getting these answers right is the difference between a solid analysis and a costly mistake.
What Is a Good Cash-On-Cash Return for a Rental Property?
This is the million-dollar question, but the answer isn’t a single magic number. It’s all about context.
While many investors I talk to shoot for a cash-on-cash return of 8-12% or higher, the “right” number is dictated entirely by your strategy and market. A lower 6% return might be fantastic for a stable, turnkey property in a high-appreciation market. You’re buying stability and betting on long-term growth.
On the flip side, you’d want a much higher return—maybe 15% or more—for a high-effort fixer-upper in a market with slower growth. The extra return is your compensation for the extra work and risk. The key is to use this metric to consistently compare different types of opportunities against your personal goals.
How Do I Accurately Estimate Future Expenses?
Guessing on expenses is a rookie move that will absolutely sink your returns. Rules of thumb like the “1% Rule” (budgeting 1% of the property’s value for annual maintenance) are a decent starting point, but you need to get more granular for a real analysis.
The most accurate way to forecast expenses is to stop guessing and start investigating. A conservative estimate is your best friend in real estate investing; optimism is your enemy.
Here’s how to do it right:
- Get Quotes: Don’t just estimate. Talk to local property managers to get real-world figures for their fees and typical repair costs in that specific area.
- Check the Big Stuff: You have to research the age of the roof, HVAC, and water heater. If they’re nearing the end of their lifespan, you need to budget for those big-ticket replacements now, not later.
- Be a Pessimist: Always, always pad your numbers. If you think repairs will cost $1,000 a year, budget $1,500. This buffer will save you when unexpected issues inevitably pop up.
Should I Include Potential Appreciation in My Initial Calculation?
In a word: no. Not for your core analysis, anyway.
For a conservative, bulletproof analysis, your deal must stand on its own two feet based on cash flow alone. Treat potential appreciation as the delicious icing on the cake, not the cake itself. A truly great investment makes you money every single month, regardless of what the broader market is doing.
You can absolutely run a separate, more optimistic scenario in your real estate investment calculator to model future appreciation. But your core “go or no-go” decision should always be grounded in the predictable, controllable reality of the property’s cash flow.
Ready to stop guessing and start making data-driven decisions? The team at ACME Real Estate has the expertise and analytical tools to help you find and vet your next winning investment. Visit us at https://www.acme-re.com to connect with an expert today.